MARY YACOOB: REIMAGINING SCIENTIFIC IMAGERY
London-based artist Mary Yacoob, who is working on a PhD titled ‘Artistic Diagrams: An Investigation through Cross-Disciplinary Dialogues across the arts and sciences’, takes scientific diagrams out of their original context to explore their aesthetic aspects and transform them into mysterious cyphers for the imagination. That invites viewers to consider how artistic and scientific practices can intersect to generate speculative and exploratory visions of research and create connections between disciplines. ‘I’m always struck’, says Yacoob, ‘by how scientific images are already beautiful, but there are still decisions about how to use them, and how to develop their aesthetic and associative possibilities.’

Gene Reg Network — cyanotype print.
The Faculty of Life Sciences at University College London recently commissioned Yacoob to make a series of prints, inspired by in-depth conversations and lab visits with researchers. She chose to use the cyanotype process to unify the look of the series. To make those, Yacoob draws in white ink on a transparent sheet of paper, which she puts on top of photo-chemically sensitive paper, then exposes it in a light box using UV light. All areas of the paper exposed turn blue due to the chemical reaction, but the ink blocks the UV rays, so those areas remain white. That yields a copy with white lines on a dark blue background – just the way architectural blueprints were made in the days before it became simple to duplicate documents. Yacoob likes the way such cyanotypes allow for the ready overlapping of images, and enables the opacity of the ink to be varied, so enhancing the range of gestures and textures available. Here we show six cyanotypes alongside a flavour of her conversations with scientists, and some of the scientific diagrams and images that inspired Yacoob’s images – all cyanotype prints in a variable edition of 30, 52cm x 70cm, 2025.

Honeybee waggle dance map — in dialogue with Prof Elli Leadbeater, Professor of Ecosystems and Biodiversity Research, UCL People and Nature Lab
Honeybee waggle dance map
In dialogue with Prof Elli Leadbeater, Professor of Ecosystems and Biodiversity Research, UCL People and Nature Lab
Prof Elli Leadbeater researches how honeybees collectively forage for nectar and pollen. A forager bee will, through their waggle dance – movement in a figure of eight pattern – convey information to other bees in their hive about the distance, direction and richness of rich flower patches relative to the beehive and the direction of the sun. Elli decodes waggle dances in order to reveal the likely location of the flowers using probability heat maps. A more dense area of dots suggests a greater probability of the location of the patch.
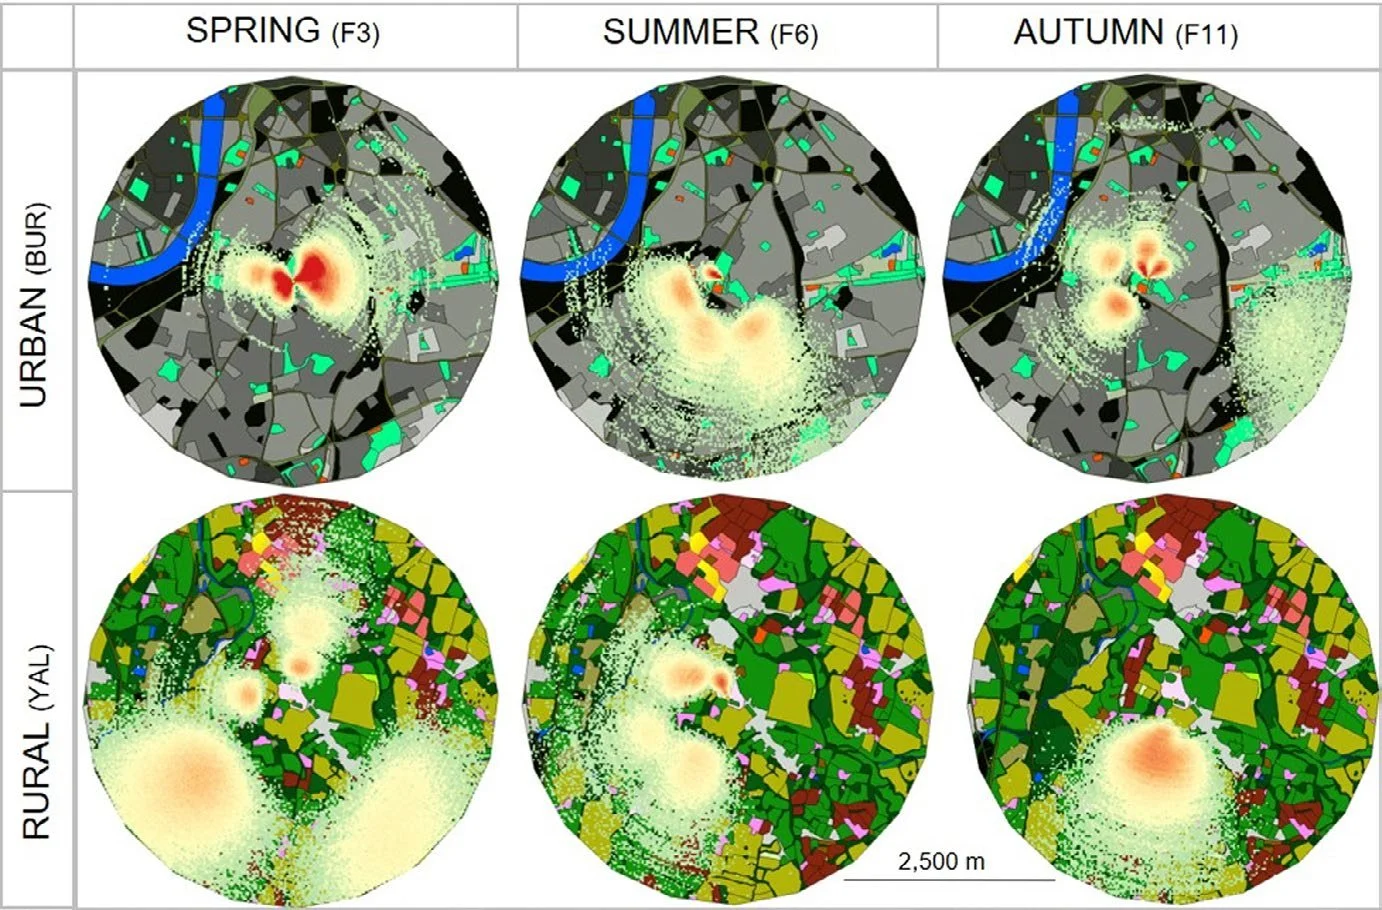
Image from ‘Dancing bees evaluate central urban forage resources as superior to agricultural land’ by Ash E. Samuelson, Roger Schürch and Ellouise Leadbeater.
Yacoob’s drawing is based on a probability heat map of rural England in springtime. Seven circular diagrams of waggle dances surround the central map. The bigger circles denote a longer waggle dance, and therefore a longer flight time. The dance's angle to vertical indicates direction relative to the sun (and the vigour shows food quality). Elli’s research in Southeast England shows that bees need to fly further away from their hive to find food in agricultural sites than in flower-rich urban areas. This suggests the need for improved floral provision on agricultural land to develop healthy ecosystems.

Self-organisation: spiral waves that shape cell motion — in dialogue with Dr Hugh Ford, Research Fellow, Laboratory for Molecular Cell Biology, UCL
Self-organisation: spiral waves that shape cell motion
In dialogue with Dr Hugh Ford, Research Fellow, Laboratory for Molecular Cell Biology, UCL.
Yacoob met with Prof Jonathan Chubb and Dr Hugh Ford to learn about their research on Dictyostelium, a soil-dwelling single-celled amoeba. To navigate the soil — a very complex environment for something so small — these cells come together to form a multicellular group called the “slug”, which can process and respond to stimuli akin to touch, smell and sight. The secret of slug development and function is in the way these single cells “talk” to each other through excitable signalling, like our brain cells.
Hugh Ford, 'Spiral Wave Progression’
Yacoob’s drawing is based on screenshots from Ford’s video, which shows a spiral pattern of excitable signalling (highlighted by a yellow curve). In the video, cells aggregate around the spiral centre, the first stage of slug formation, or “birth”. By overlapping several spiral lines onto the final illustration, Yacoob’s drawing displays different snapshots of this development stage in a single two-dimensional image. Yacoob noted, “animations can display a dynamic process unfolding over time. In using super-imposition, I wanted to explore how a drawing can enable people to view different stages of a dynamic process at one time”.

Electrospun fibres in drugs for spinal cord regeneration — in dialogue with Dr Karolina Dziemidowicz, Lecturer, UCL School of Pharmacy
Electrospun fibres in drugs for spinal cord regeneration
In dialogue with Dr Karolina Dziemidowicz, Lecturer, UCL School of Pharmacy
Dr Karolina Dziemidowicz investigates how drug-loaded electrospun fibres can best be designed to guide the migration of fibroblast cells in the body, so that wounds can be healed more efficiently. Dr Dziemidowicz showed Yacoob images of fibroblast cells migrating along aligned electrospun fibres loaded with riluzole, a drug which promotes spinal cord regeneration – ‘very beautiful images’, says Yacoob, ‘of the thin lines of drug fibres’. She also showed Yacoob diagrams of spinal cords in order to explain the effects of the drug on the body.
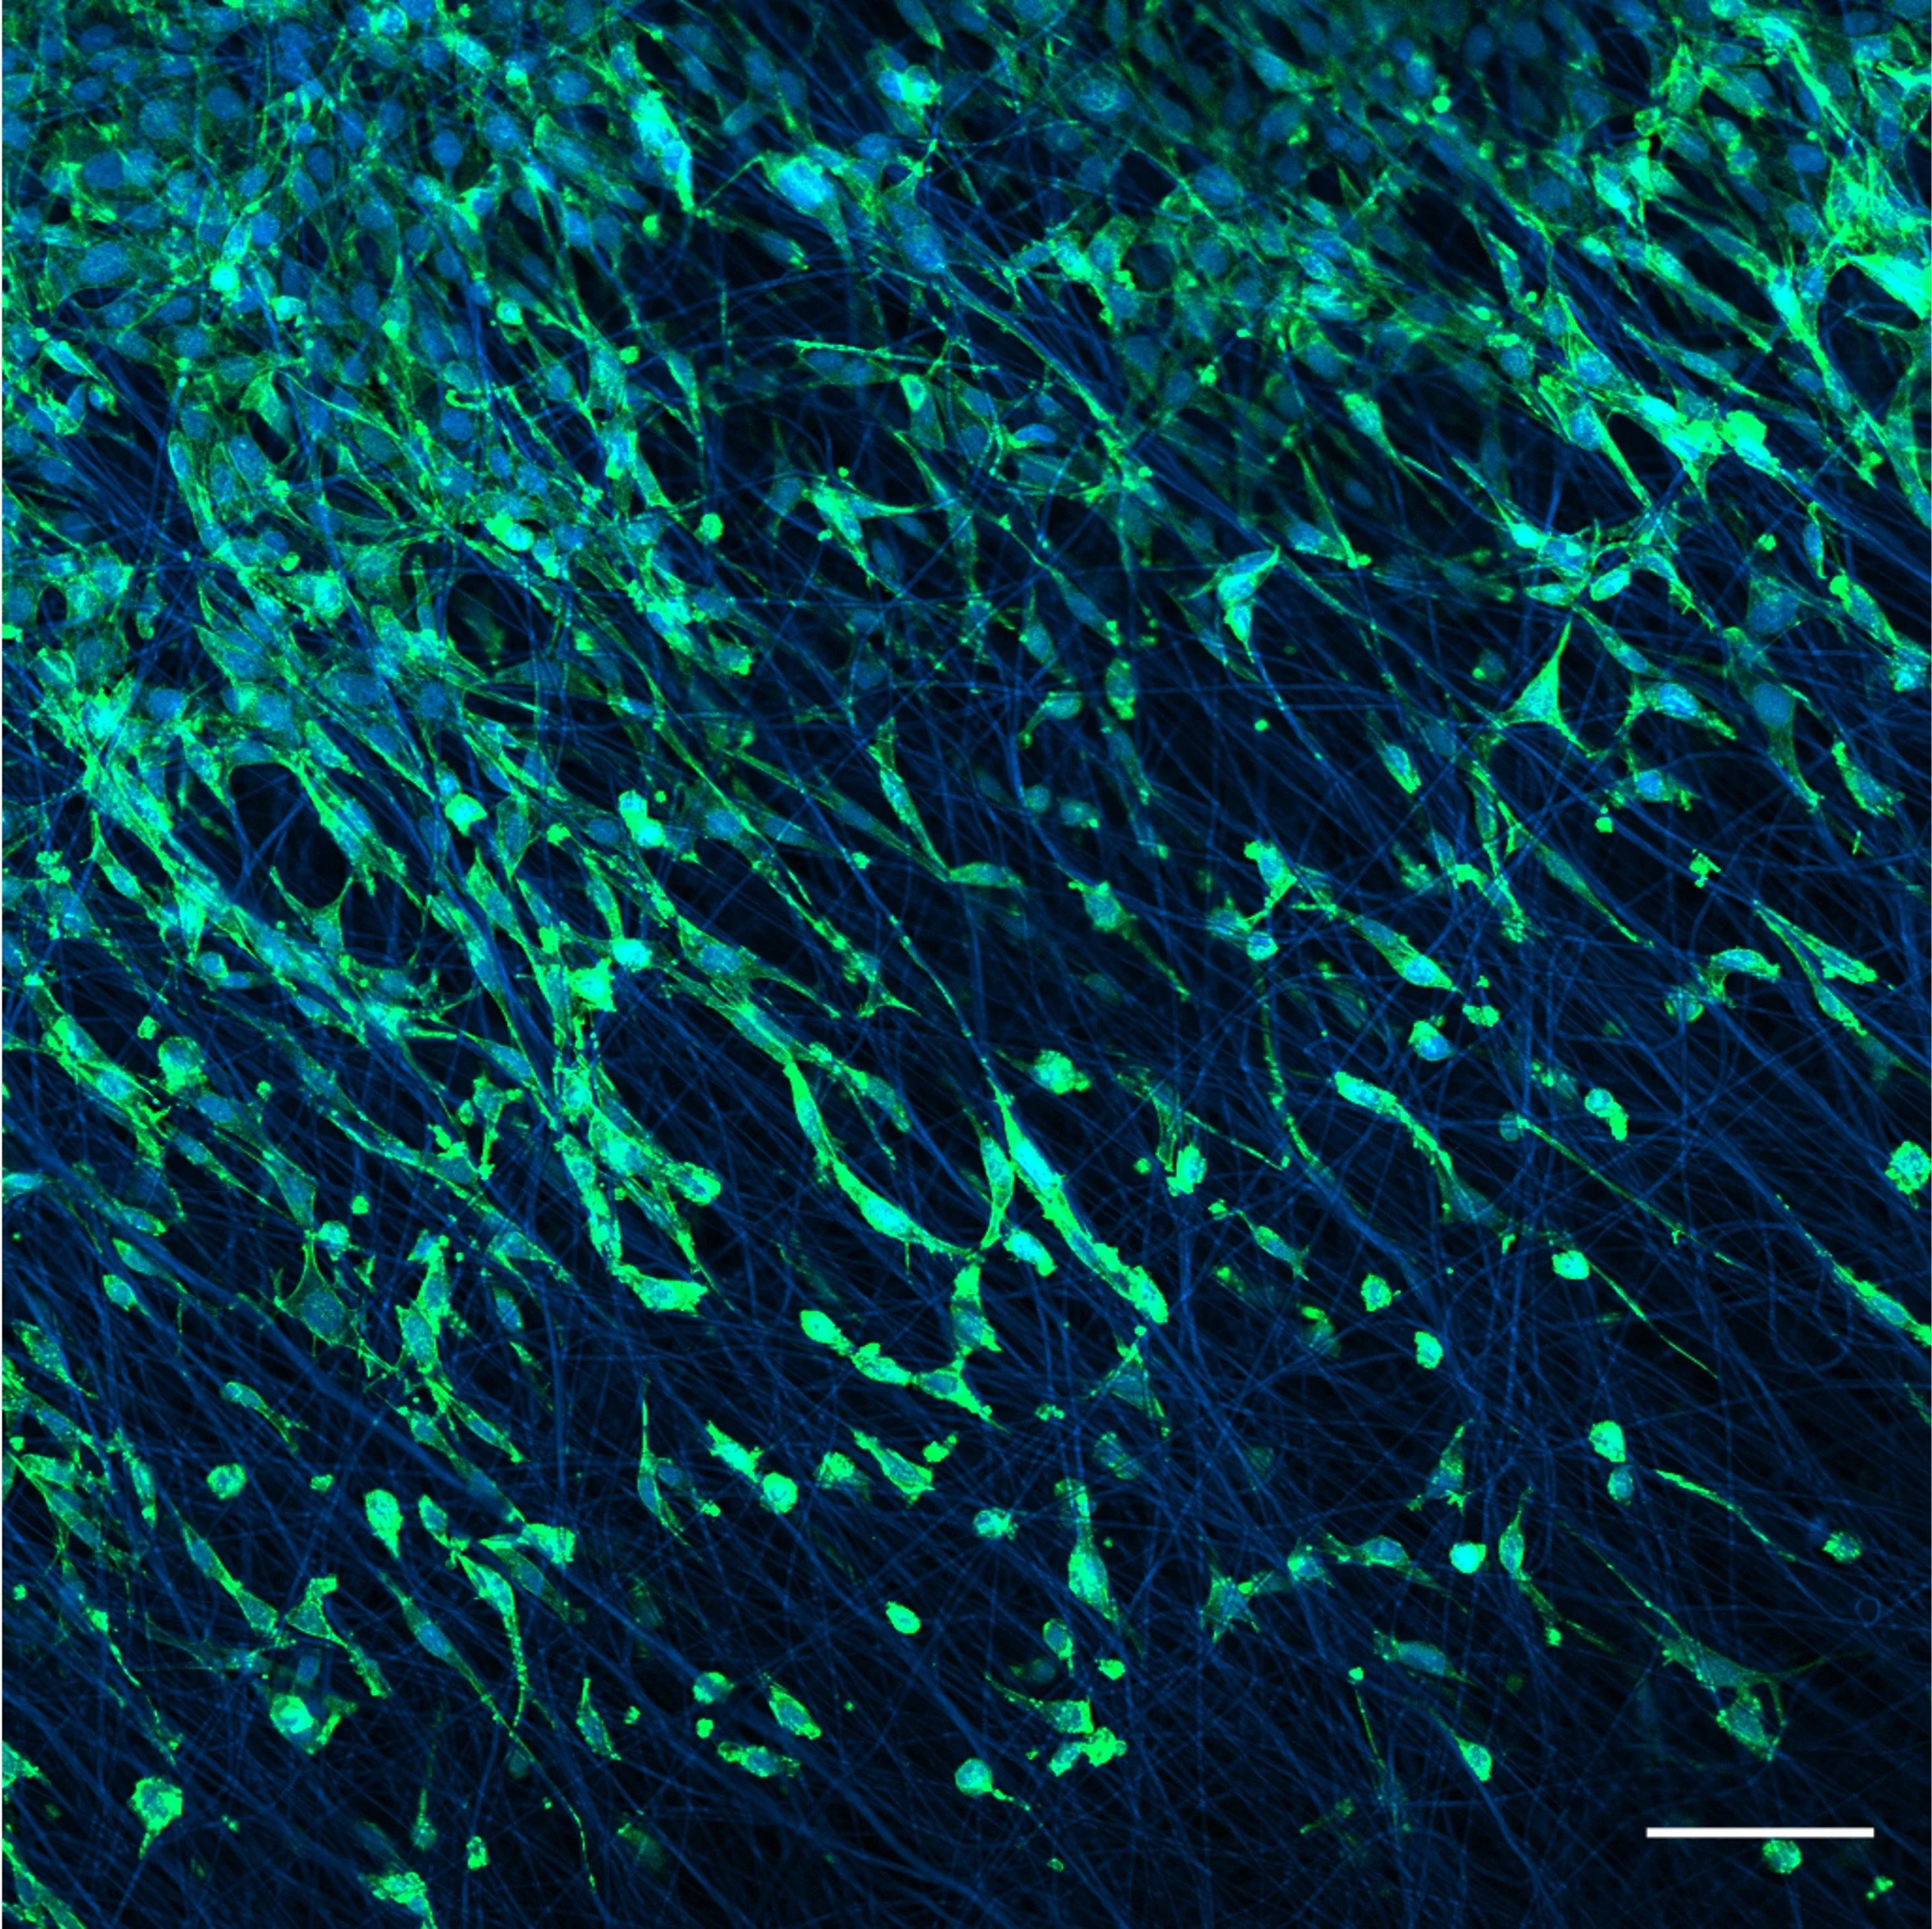
‘A confocal micrograph showing the migration of fibroblasts seeded on drug-loaded implants for spinal cord injury’. Image taken by Mathilde Ullrich and Karolina Dziemidowicz
Yacoob’s drawing superimposes images of the cells and individual electrospun fibres onto a cross-section diagram of the spinal cord. Overlapping the images of the healing fibre patches onto a representation of the body serves to illustrate their intended purpose and destination. The drawing merges different bodily spatial and temporal scales in the healing process – the spinal cord cross-section might be about 20 x life size, but the drug fibres are multiplied thousands of times. ‘The white blobs in my drawing’, explains Yacoob, ‘are healing cells which the fibres in the drug are designed to align with, so as to promote faster healing’.
Wave and ray optics — in dialogue with Dr Isabell Whiteley, In Vivo Imaging Specialist, Sainsbury Wellcome Centre.
Wave and ray optics
In dialogue with Dr Isabell Whiteley, In Vivo Imaging Specialist, Sainsbury Wellcome Centre
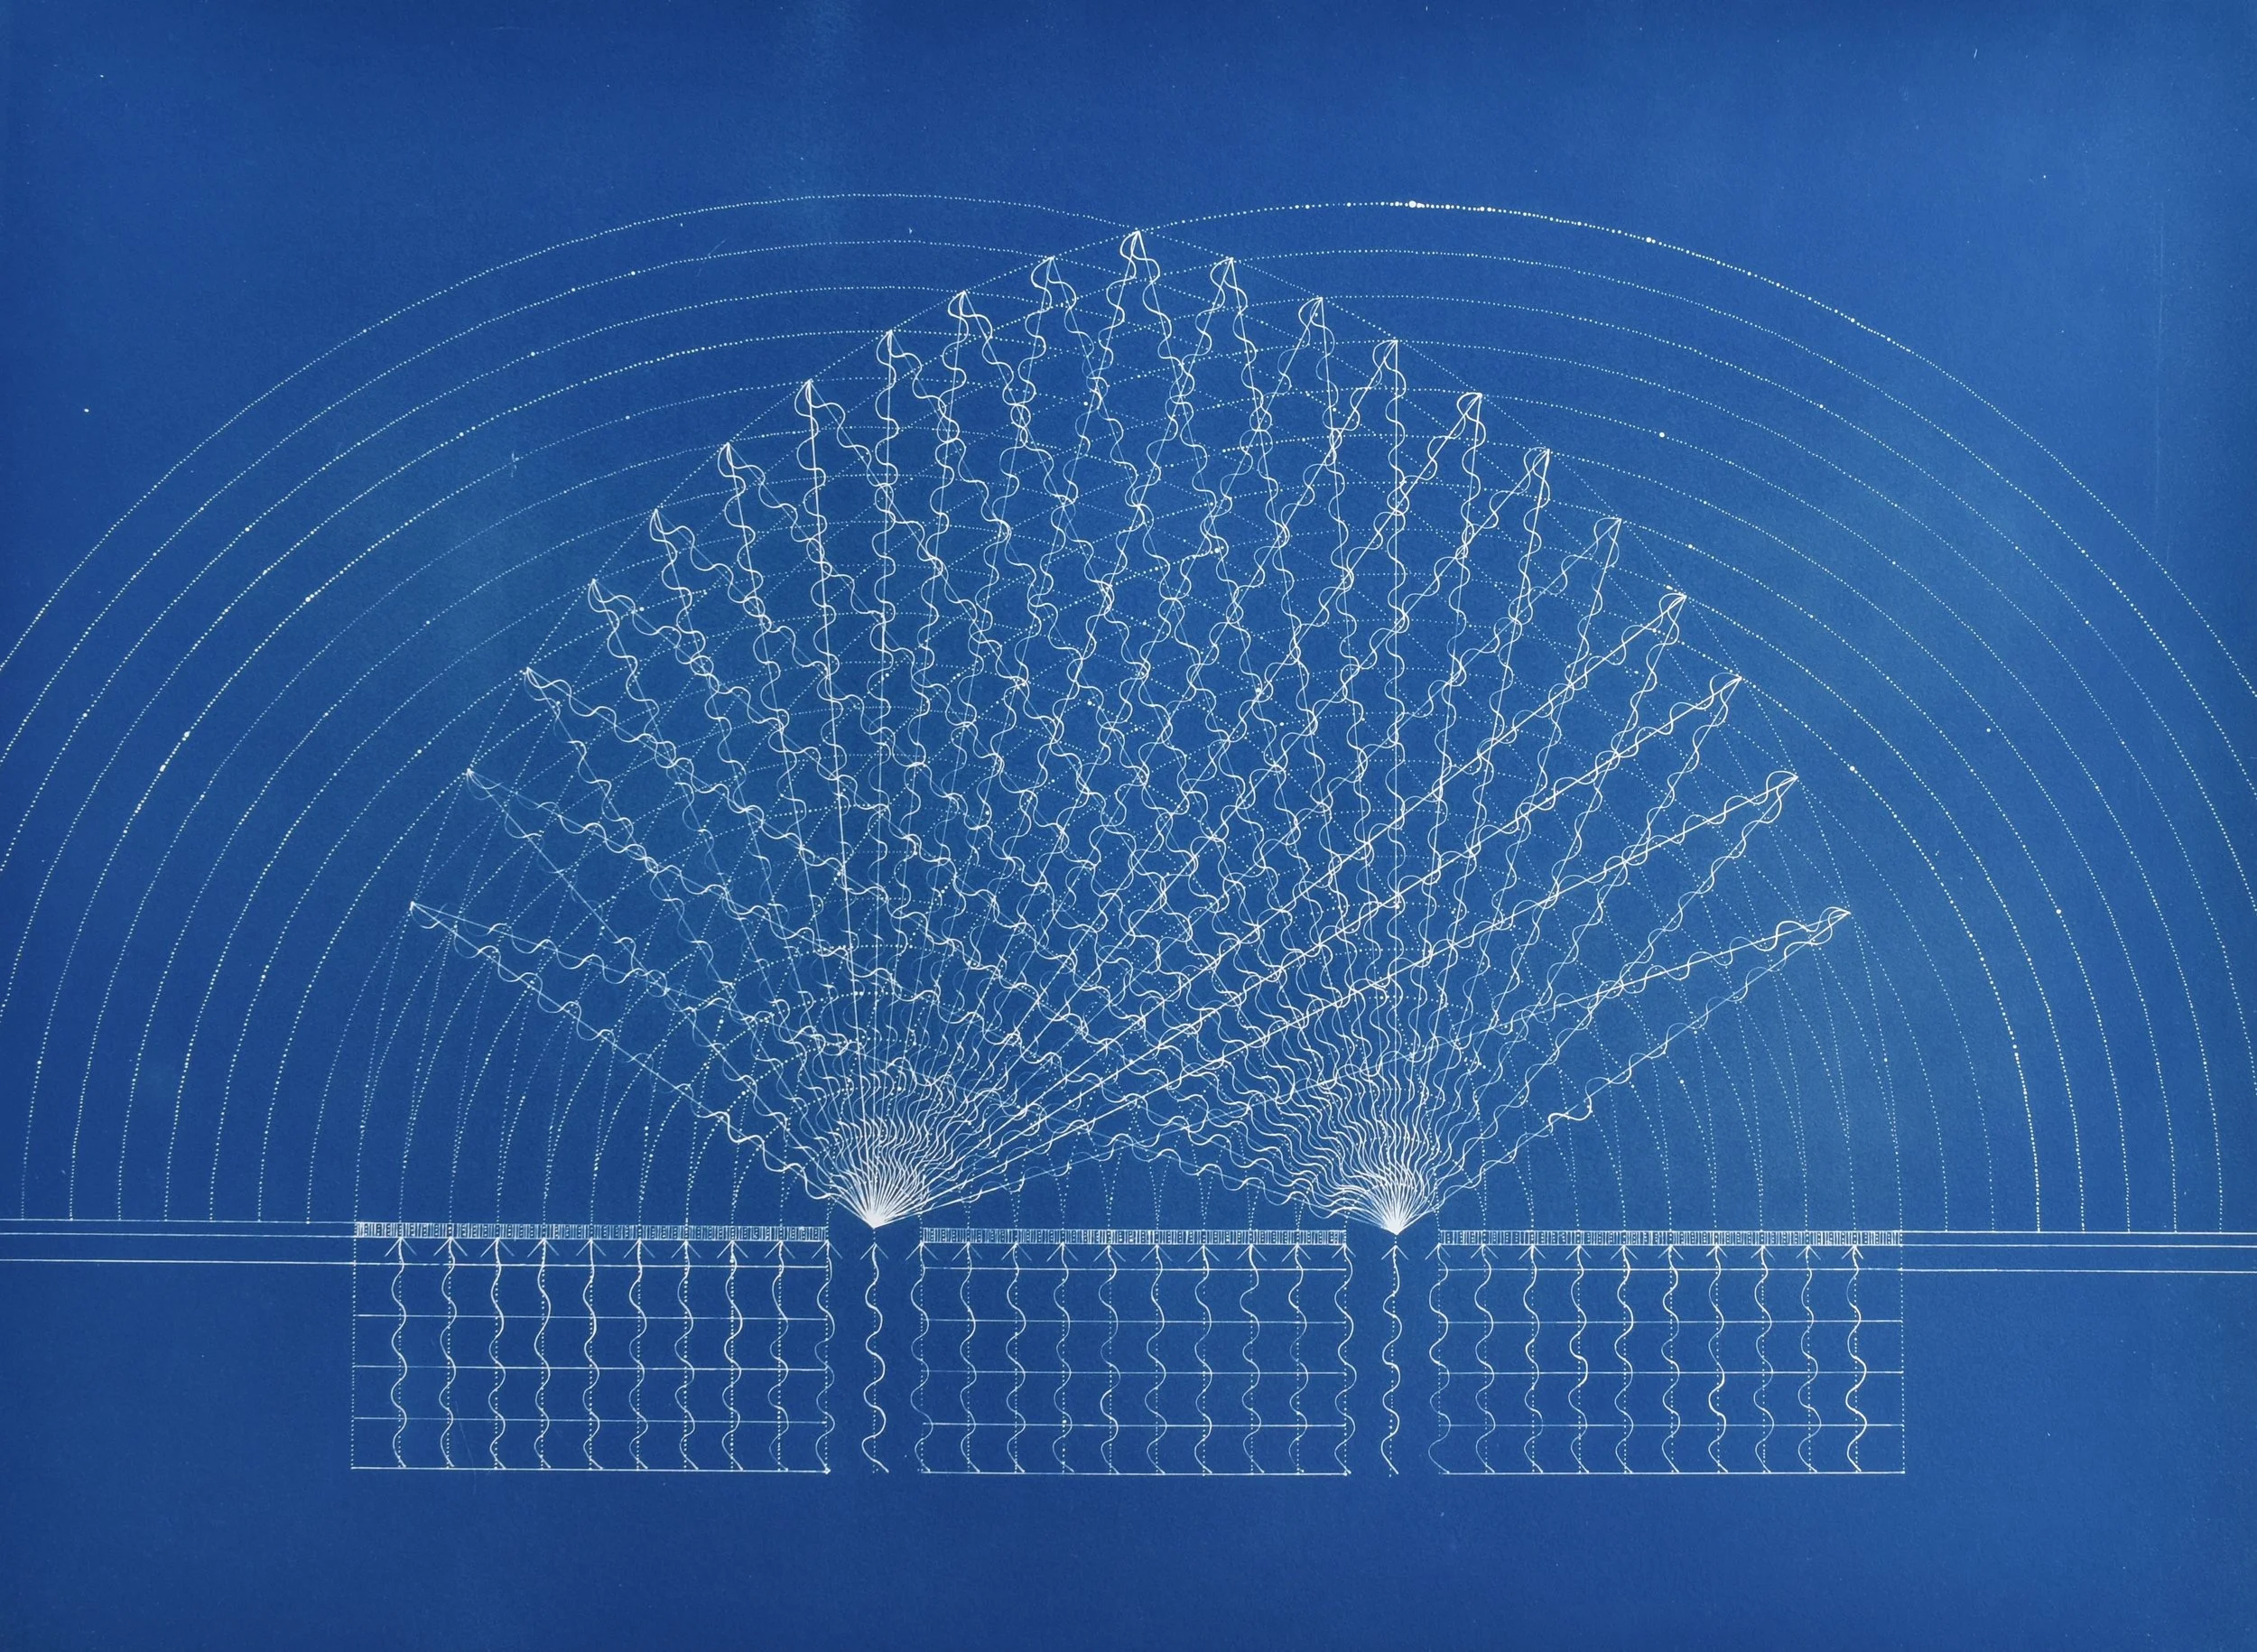
In her discussions with Yacoob, Dr Isabell Whiteley observed that diagrams of light rarely depict both waves and rays, even though both are needed to fully explain how light behaves and the wave-particle duality of light. Ray optics explain properties such as reflection and refraction, whereas wave optics are used to explain other properties such as diffraction and interference. Yacoob decided to make a drawing that combines both these aspects by basing her drawing, at Dr Whiteley’s suggestion, on Thomas Young’s double slit experiment, which proved the wave nature of light in 1801. Light shines through two narrow slits in a barrier, forming two waves of light.
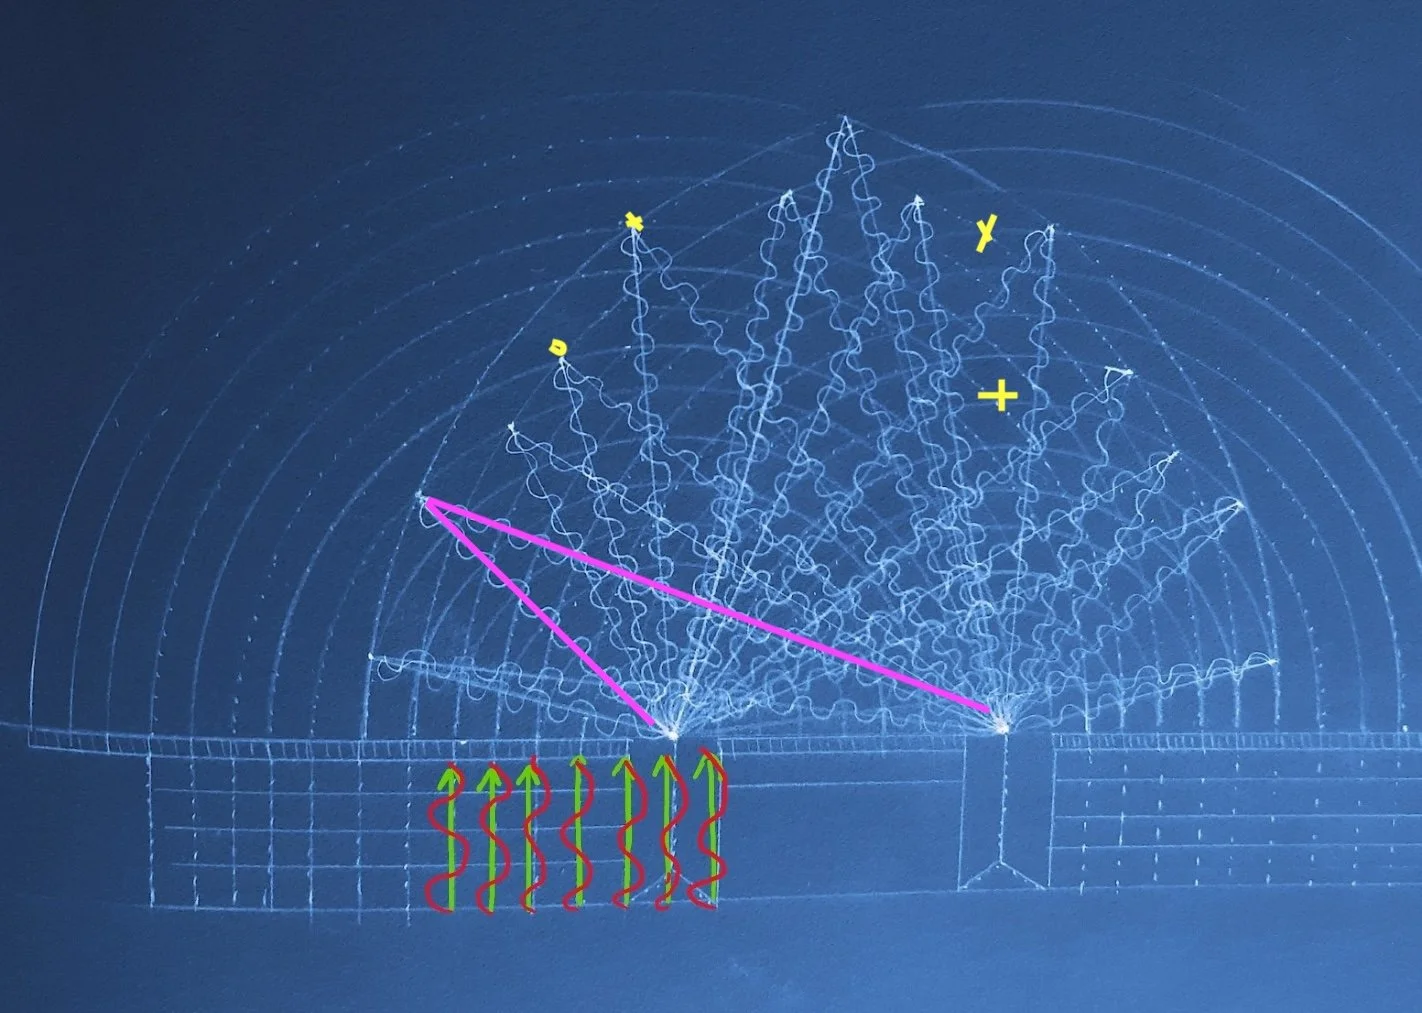
Working sketch by Mary Yacoob with some additions by Dr Isabell Whiteley.
Yacoob’s drawing highlights a geometric property of Young’s diagram: the dome shape that occurs where two sets of light waves meet in the middle. The dome shape highlights points of constructive interference (where two light sources meet) – but also suggest an edifice of light, a crystal palace, perhaps – Yacoob explains that she found it helpful to ground representations of the complexities of the physics of light in something more familiar and tangible, like an architectural structure.

Wood-wide web — in dialogue with Prof Stephen Price, Professor of Developmental Neurobiology, Department of Cell and Developmental Biology, UCL
Wood-wide web
In dialogue with Prof Stephen Price, Professor of Developmental Neurobiology, Department of Cell and Developmental Biology, UCL
Prof Stephen Price discussed with Yacoob his interest in ‘systems thinking’ and in the understanding of biology as an intrinsically interconnected, dynamic and process-driven set of systems. For example, Stephen showed Yacoob diagrams of the ‘wood wide web’ which reveal how the roots of trees are connected to each other via underground fungal networks, facilitating the mutually beneficial exchange of nutrients.
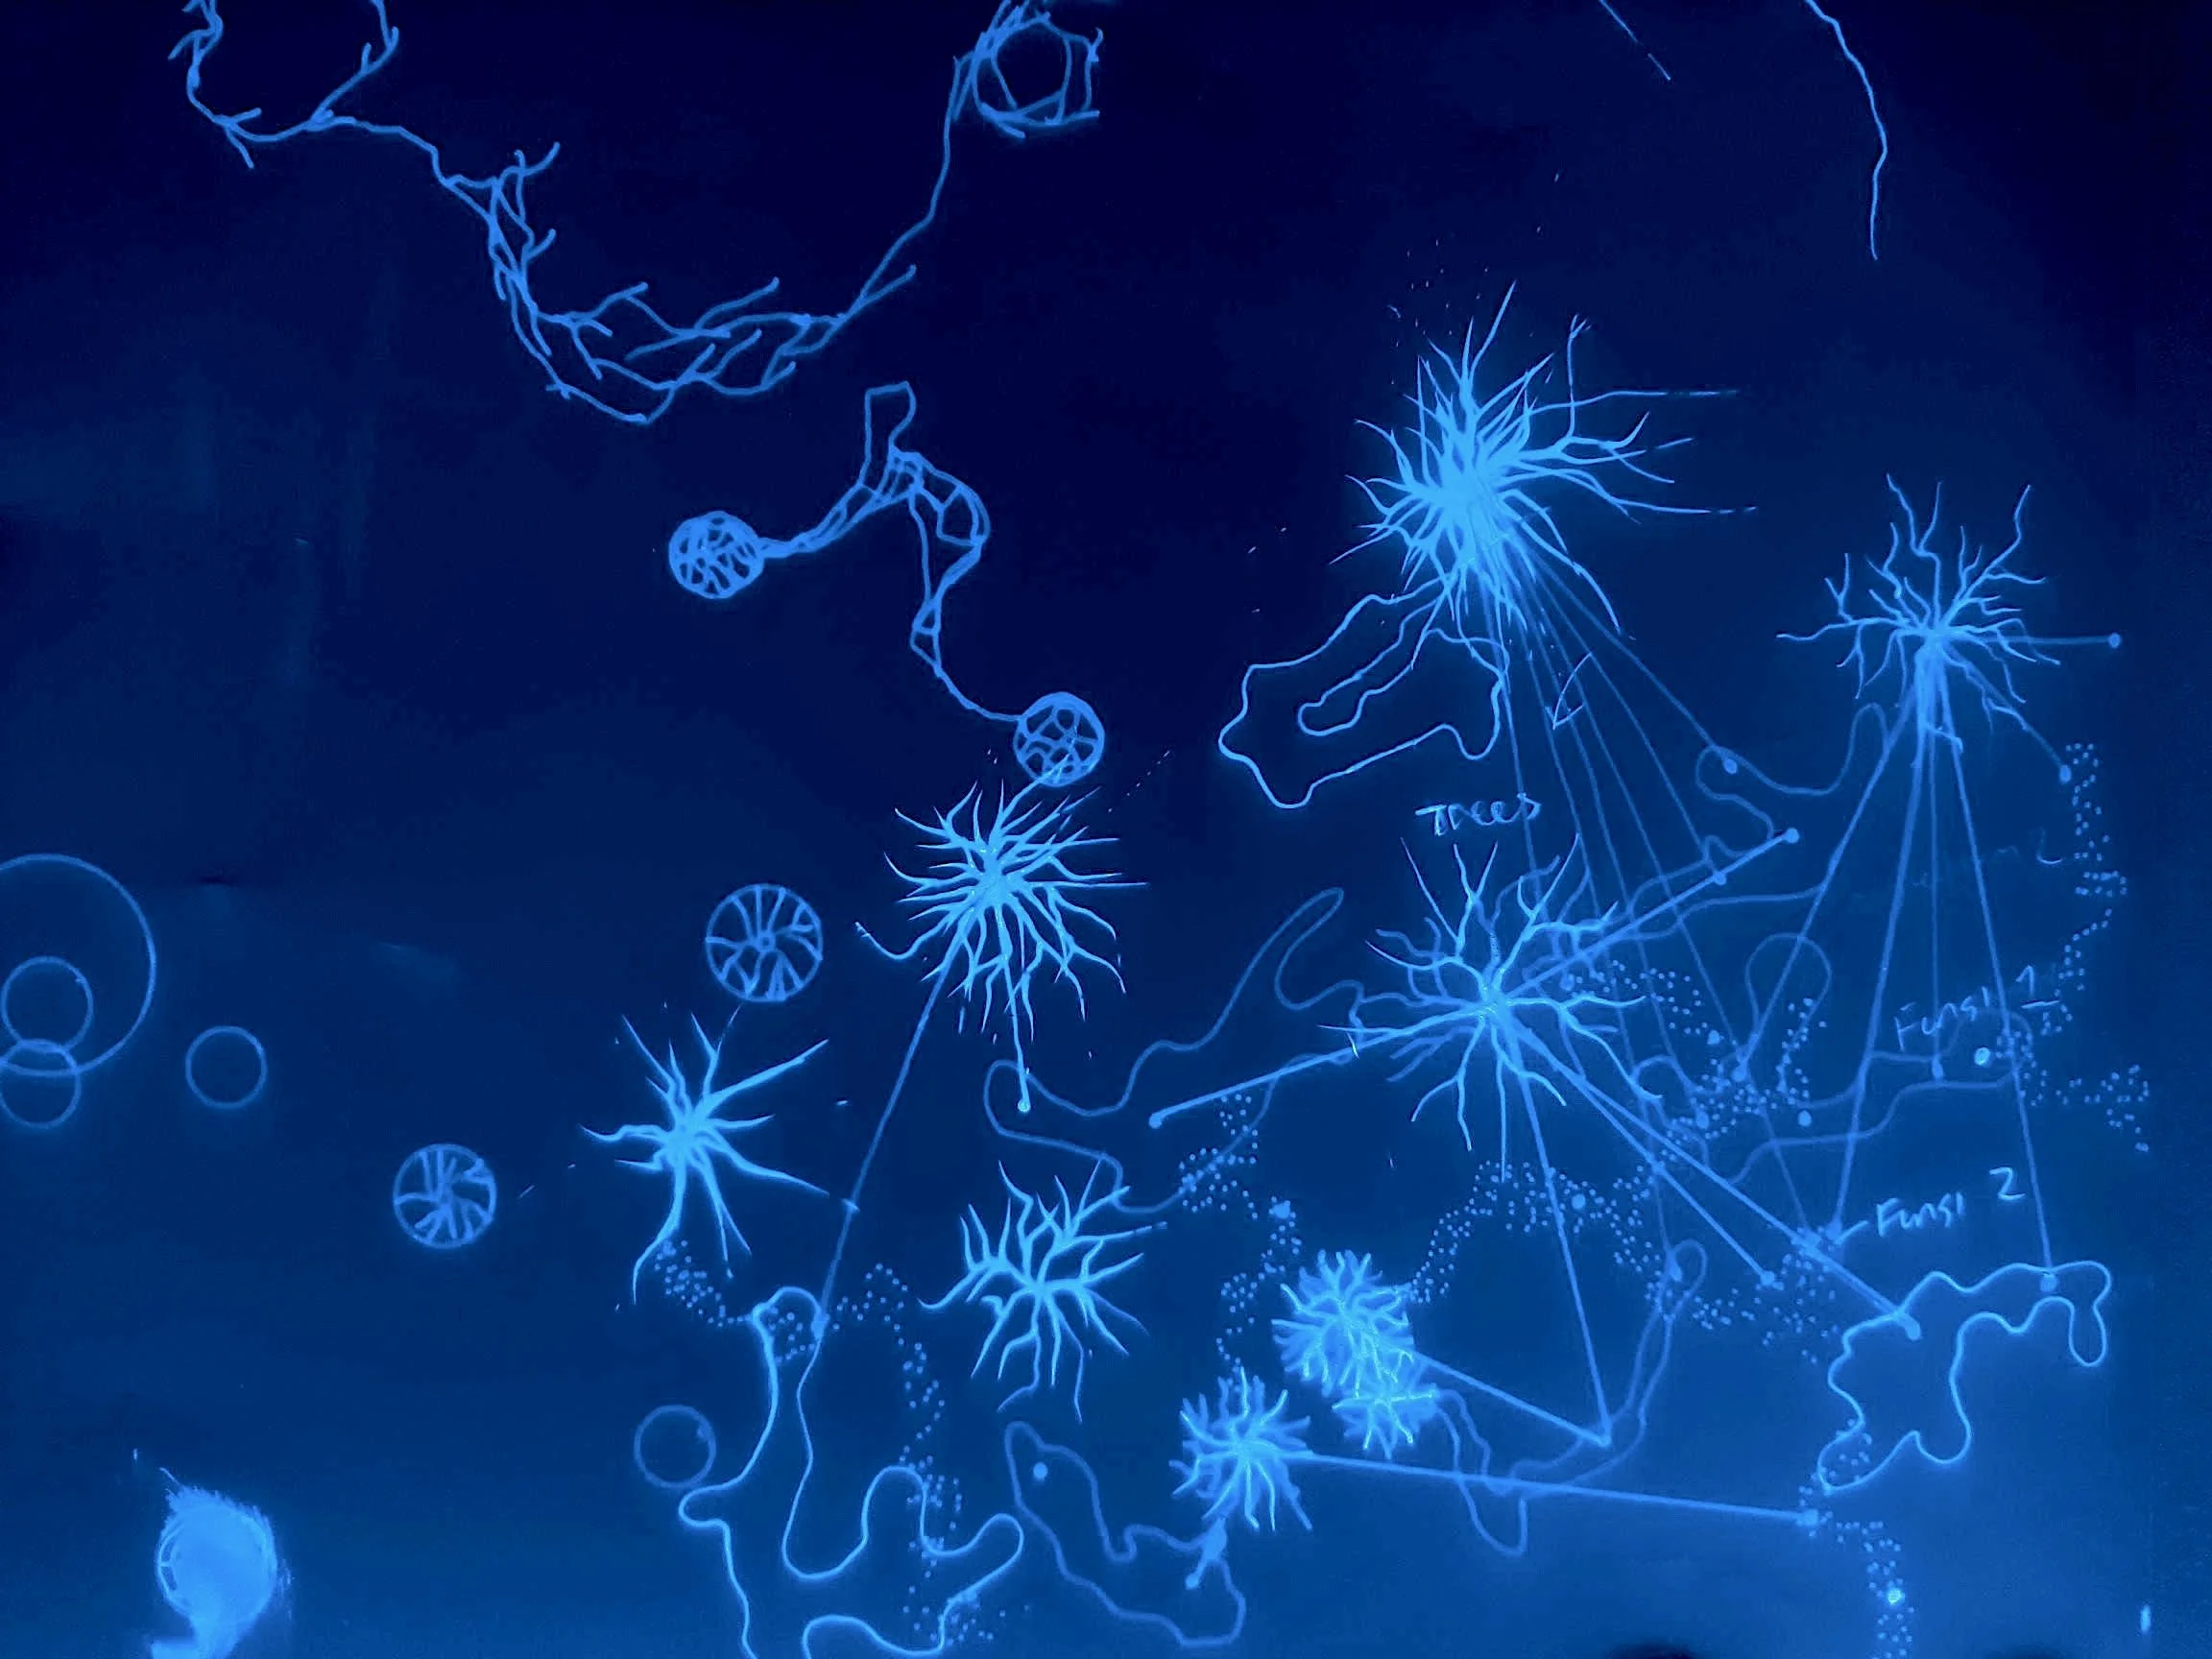
Working sketch by Mary Yacoob.
In Yacoob’s drawing, the diameters of tree trunks are represented in icons of radial patterns suggestive of branch-like growth, forming an aerial view of a woodland. Two types of fungal colonies are shown in blocked or dotted meandering curves. Lines show which trees are most highly connected with fungal networks. The artwork draws attention to the symbiotic webs which are fundamental to these ecosystems.

Unifying representations in biological and artificial systems — in dialogue with Clémentine Dominé, PhD Student, Gatsby Computational Neuroscience Unit, UCL
Unifying representations in biological and artificial systems
In dialogue with Clémentine Dominé, PhD Student, Gatsby Computational Neuroscience Unit, UCL
Clémentine Dominé researches how representations of the brain and of artificial networks align or diverge, in order to reveal key computational similarities and distinctions, despite differing physical substrates and architectures. Dominé provided Yacoob with an illustration she created using Artificial Intelligence. The drawing that Yacoob produced in response to this suggests a more speculative integration of organic and artificial systems.
Yacoob’s drawing adopts, deconstructs and merges symbols found in diagrams of neurons, circuit boards and artificial neural networks. The central image is inspired by a cross-section of a human brain. Frayed boundaries blend the central image into its surroundings, reflecting the notion of extended cognition — the idea that cognition involves networks of connections between the brain, body, tools, and the environment. It suggests, says Yacoob, there’s thought going on outside the brain’s structure as well as future possibilities in brain-machine synchronisation.
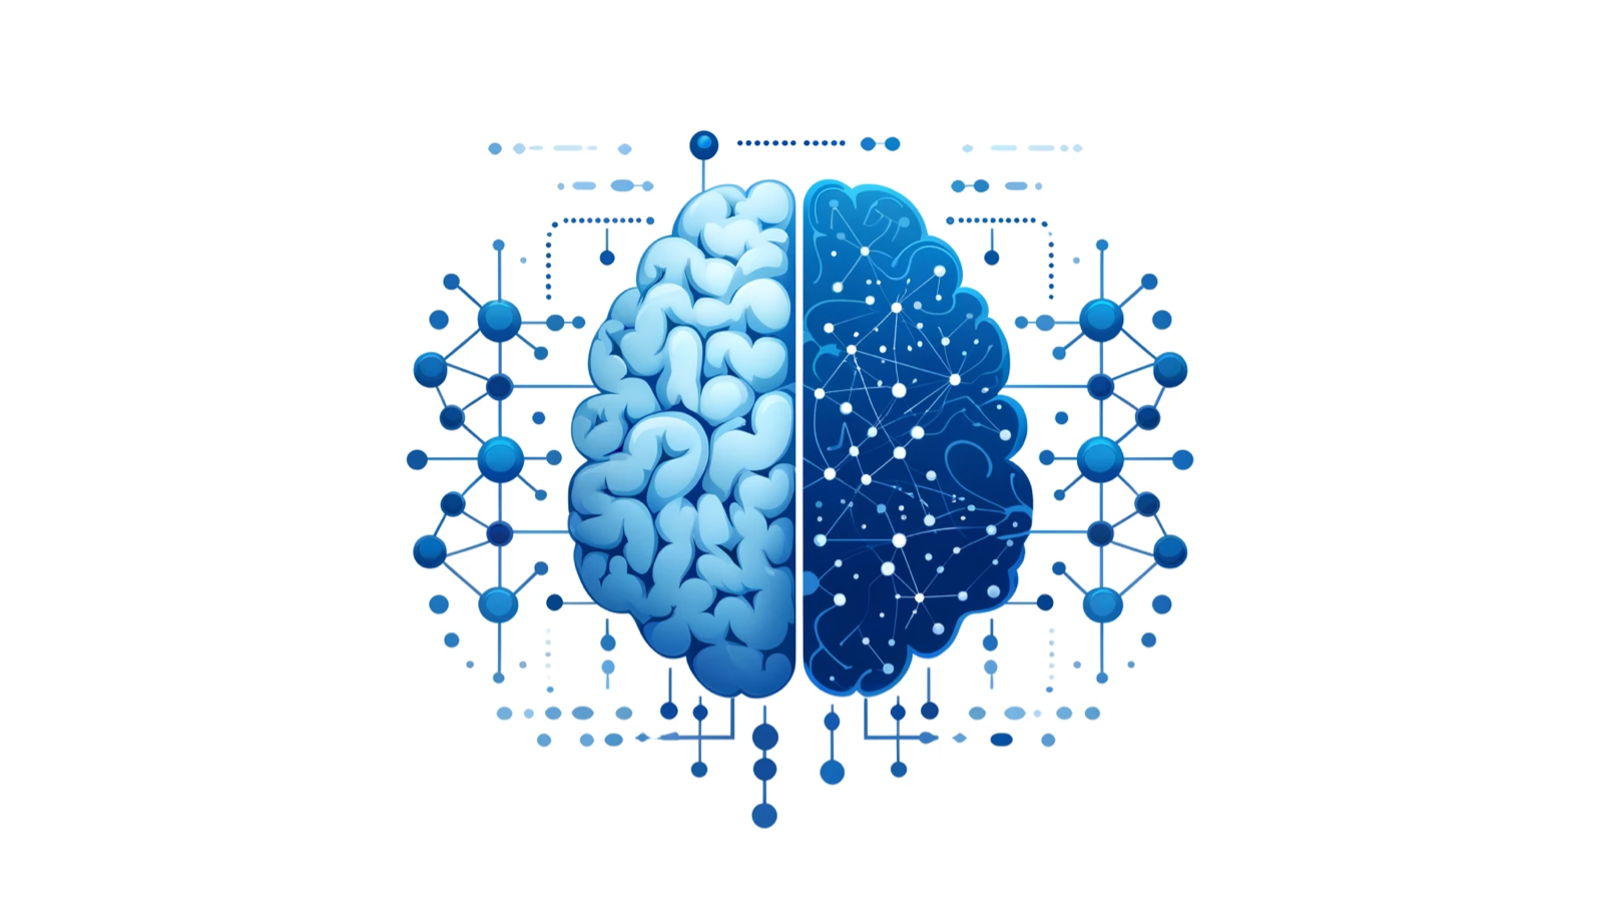
‘Neurograph: Emergence Across Systems’, AI-generated image by Clémentine Dominé.
Mary Yacoob’s set of prints ‘Reimagining Scientific Imagery’ is on permanent display in UCL’s seminar rooms. She is co-author of the book ‘Drawing Analogies: Diagrams in Art, Theory and Practice’ with artists and academics David Burrows, John Cussans and Dean Kenning, Bloomsbury Publishing in 2025. An online version is available on open access, funded by UCL. That includes Yacoob’s account of ‘Intersections between Art, Diagrams, Time and Technology’ and her analysis of ‘The Diagrammatic Works of Hilma af Klint’.
More information can be found on Mary Yacoob and her work here.
All images and video shown courtesy the artist, collaborator, and gallery 2026. All rights reserved.